Countywide Lifeform and Cropland Datasets Available
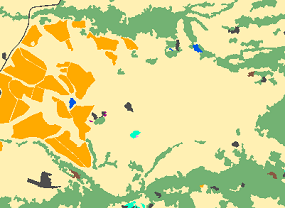
Draft Lifeform Map: We are excited to announce that a draft lifeform map is complete and available for
download. It will serve as the foundation for the more detailed vegetation and habitat map to come.
This 18-class map was developed using a combination of automated, software-based processes and the
input of GIS and vegetation analysts. Follow this link
to learn more about the lifeform mapping methods.
The draft lifeform map will be refined in 2016 based on the field work and additional manual editing
associated with producing the full 62-class fine-scale vegetation and habitat map due out in late 2016.
Until then, the lifeform map can serve as an excellent reference map with high accuracy
(read the accuracy assessment at the end of the
product datasheet). Please reference this
as a draft data product in your maps, analysis, and derivative products.
Final Croplands: The Sonoma County Croplands map, which we released as a draft product in the spring,
has been updated and finalized. The croplands data provides a countywide fine-scale polygon map of perennial croplands, annual
croplands, nurseries, orchards/groves, vineyards, and other crops. The croplands were mapped by image analysts using aerial
photographs as ground reference and - as for the lifeform dataset above - this layer represents the state of the landscape in 2013.
The croplands data combines many years of quality mapping work by many hands - including Circuit Rider Productions,
Dr. Adina Merenlender’s Lab (UC Berkeley), the Sonoma County Agricultural Preservation and Open Space District,
and the Sonoma County Water Agency - into one seamless dataset. During the past year, the Sonoma Veg Map mapping
team has further improved and standardized the data, adding hundreds of new polygons and refining the majority of existing ones.
The lifeform and croplands are available as services from ArcGIS.com and as GIS data downloads (shapefiles and geodatabases). To download the
data, go to the
data downloads page on our web site. Also, download the product datasheets for the croplands and lifeform datasets.
For an immediate look at the lifeform map, check out this webmap.
back to top
LiDAR-Enhanced Hydrologic Datasets Available in November
The Sonoma County Agricultural Preservation and Open Space District, the Sonoma County Water Agency, and the County of Sonoma
GIS Group are teaming up to fund a package of new hydrologic data that will enhance water resource management and hazard risk
assessment in the county. These data products use the NASA-funded 2013 countywide LiDAR data and will allow for very accurate and
detailed hydrologic modeling and analysis. The new LiDAR-enhanced countywide hydrologic data products are as follows:
- Stream centerlines
- Watershed delineations
- Hydro-enforced Digital Elevation Model (DEM)
- Flow direction raster
- Flow accumulation raster
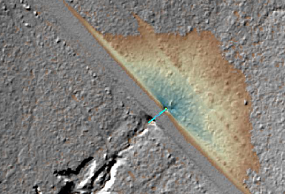
The hydro-enforced DEM is a foundational dataset required for accurate hydrologic modeling. This dataset, which would not be possible
without countywide LiDAR, will provide the Department of Emergency Services, the Sonoma County Permit and Resource Management Department,
and other county agencies with the foundation needed for accurately modeling flood extent and preparing flood response plans for the Russian River
and other flood prone areas in Sonoma County.
We expect to announce the availability of these new datasets in late November.
back to top
Impervious Surface Map Available this Fall
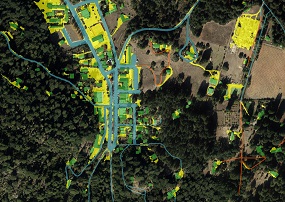
Later this fall, Sonoma Veg Map will release the countywide impervious surface map. The impervious surface map
will serve as a fine-scale representation of all artificial impervious surfaces in the county. This dataset will provide useful
information to water managers, hydrologists, land use planners, and scientists. Below are example uses of impervious surface
layers in addressing societal challenges:
- Analyzing impacts of land development on water quality, groundwater reserves, and fish habitat
- Modeling stormwater flood potential
- Mapping habitat fragmentation
There are many ways to map impervious surfaces. We are pleased to be working with LiDAR and impervious
surface mapping experts at the University of Vermont’s Spatial Analysis Laboratory, led by Dr. Jarlath O’Neil-Dunne. Working with
Sonoma Veg Map lead consultant, Tukman Geospatial, Dr. O’Neil-Dunne and his team are using a semiautomated 'expert systems' approach
to produce the impervious surface map. The University of Vermont team recently completed the roads phase of impervious mapping and are
now hard at work mapping the hundreds of thousands of other impervious areas, such as parking lots, driveways, tennis courts, etc.
We expect to announce the availability of this dataset later this fall.
back to top
Fine Scale Mapping Key Complete
The California Department of Fish and Wildlife's Vegetation Classification and Mapping Program (VegCAMP) has completed a draft
alliance-level classification for Sonoma County vegetation types based on the Manual of California Vegetation. This first-ever
classification uses the over 800 relevé and rapid assessment surveys collected in 2013 and 2014 as the first phases of Sonoma Veg Map.
With input from the California Native Plant Society and the rest of the Sonoma Veg Map team, the classification has been refined and
is now being put to use in map reconnaissance field work.
Because some vegetation alliances (what is an alliance?) are not distinguishable using aerial imagery or occur in very small stands
below the project’s minimum mapping unit, not all of the described vegetation classes will be mapped to the alliance level. In these cases,
alliances have been grouped into larger, mappable assemblages of alliances (usually at the National Vegetation Classification Group or Macrogroup level).
For example, numerous difficult-to-distinguish riparian alliances will be lumped together and mapped at the group level. Most herbaceous
alliances are also mapped at Group or Macrogroup levels.
The final fine-scale map (due out in late 2016) will include 62 vegetation classes, while over 100 alliances in total were
described in the county (many of them herbaceous alliances). The mapping key (available now) includes all the mappable classes;
the full floristic key (available in the next few months) includes all alliances and associations.
Here is a list of classification products that are now (or soon to be) available:
Sonoma Veg Map owes a debt of gratitude to Todd Keeler-Wolf, Anne Klein and the other members of the VegCAMP team for their dedication to the Sonoma County Vegetation and Habitat Map! Thanks also to Joan Schwan (Prunuske Chatham, Inc) and
Julie Evens (CNPS) for your work on the keys!
back to top
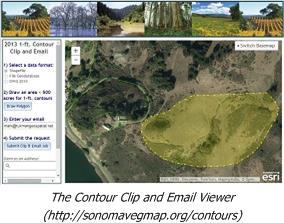
Contour Viewer Enhancement - Specify a Contour Interval
Late last year, we released the contour clip and email viewer, an online tool that provides easy download options for the countywide 1-foot LiDAR derived contours.
This simple viewer provides free access to contours pre-clipped to your project area – you define the area on a map and a few minutes
later receive an email with a link to download your clipped data. The viewer provides data for areas up to 500 acres
(for larger areas, use the download by watershed option at our data downloads page). We are excited to see and hear that
these viewers are being used regularly by a wide variety of users throughout the region.
We are equally excited to announce a new enhancement: The contour viewer now has an option to deliver contours in any user-specified contour interval.
Until now, only 1 foot contours were available from the viewer. Now, users can enter any whole number value in the "Interval"
field and receive only the contours divisible by that number. We think this enhancement will significantly
improve the usability of the contour data.
The idea for interval choice enhancement came from the user community. Thank you! Please continue to share your ideas for improving access and use of Sonoma Veg Map data.
back to top
|