Easy Access to 1-Foot Contours
Planners, engineers, landscape architects, and rural landowners are among the many who have shown keen interest in the 1-foot contours, one of SonomaVegMap’s most useful LiDAR derived products.
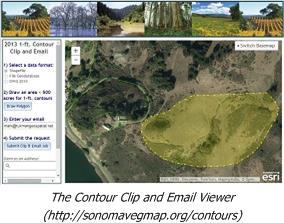
The contours are freely available and now even easier to obtain. Our new contour clip and email tool gives you contours pre-clipped to your project area.
This simple internet tool provides clipped contours for areas of interest less than 500 acres (use the download by watershed option for larger areas of interest).
Here’s what you do:
Step 1. Draw your area on screen.
Step 2. Specify one of three GIS/CAD formats for your contours (GDB, SHP, or DWG).
Step 3. Enter your email address and you’re off and running.
A few minutes after ordering, you’ll receive an email with a link to download your contours. This tool is still in beta at this time. Please let us know about your experience.
Coming Soon! Early next year we’ll be releasing a second viewer – an image clip and email viewer – that will allow for easy download of 2011 orthophotos, 2013 orthophotos, and raster LiDAR derivatives such as hillshades, DEMs, canopy height, etc. For this second viewer, the area of interest limit will be increased to 2,000 acres.
back to top
Wider Access to 2013 LiDAR Data
Last month OpenTopography, a leading portal to high-resolution topography data and tools, began to host and distribute Sonoma County's new LiDAR data.
OpenTopography is part of a network of important national cyberinfrastructure research environments, funded by the National Science Foundation (NSF) and
hosted at the San Diego Supercomputer Center at UCSD. With an excellent toolset for visualizing and downloading Sonoma County LiDAR data,
OpenTopography provides access to your LiDAR data as Google Earth KMZs, standard DEM and hillshade products, and the raw or filtered point cloud clipped to a user's area of interest.
Also in November, the LiDAR data was made publicly available on the NOAA Digital Coast Data Access Viewer.
the NOAA viewer provides access to the compressed point cloud (.laz format). In addition, the user
can configure custom coordinate systems for both the point cloud and derived outputs.
Derived outputs include raster elevation models as well as contours for rectangular or square areas.
Availability on OpenTopography and NOAA Digital Coast complements a growing number of options for downloading Sonoma's County's LiDAR. For details on download options,
click here.
For the list of data products that are available now, click here. For more background on LiDAR check
out this blog post or this basic one page LiDAR primer. Also check out the presentations from our
LiDAR and Environmental Data Forum.
back to top
NASA Carbon Monitoring System Conference
As a key member of the Sonoma County Vegetation Mapping and LiDAR Consortium, NASA provided funding for the collection of the
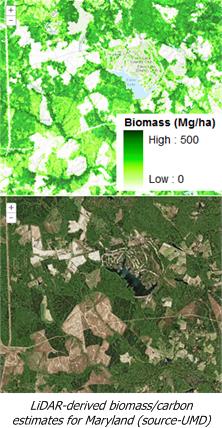
classified 2013 LiDAR point cloud and orthophotography for Sonoma County. Under an earth science research grant to support NASA’s Carbon Monitoring
System program, Dr. Ralph Dubayah of the University of Maryland (UMD) is using the LiDAR data to map aboveground carbon stored in vegetation biomass.
In November, Karen Gaffney and Tom Robinson of the Sonoma County Agricultural Preservation and Open Space District traveled to
Washington DC to speak at a NASA/UMD Carbon Monitoring System science team meeting on behalf of local end users of CMS data.
The talk highlighted the significant benefits of CMS data to Sonoma Veg Map as well as other climate-related
studies the District is conducting, including demonstrating the link between local land conservation and reduced greenhouse gas emissions,
and the full value of healthy ecosystems to local communities. NASA continues to be a valued collaborator and we look forward to working
with NASA and UMD scientists on developing fine-scale data to support climate adaptation and mitigation activities at the local level.
back to top
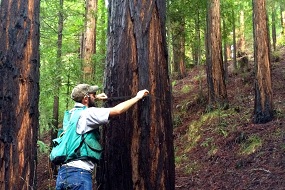
Carbon Plot Collection Wraps Up
As was noted in the above item, Dr. Ralph Dubayah from the University of Maryland is
producing a map of carbon sequestered in Sonoma County's live vegetation. This NASA-funded work requires detailed vegetation plot
data about tree size, density, and height.
Botanist Aaron Arthur (WRA, Inc) has been bushwhacking his way through Sonoma County since early Spring and has now collected 177 out of a total of 200 planned
vegetation plots. Aaron hasn’t calculated his miles hiked yet, but during his plot collection peregrinations Aaron has added 2,571 miles to his odometer!
Aaron will complete his data collection by the end of the year, and Dr. Dubayah’s team will be off and running to create the biomass and carbon map.
back to top
GIS Day Talk

On November 19th, Tom Robinson and Mark Tukman delivered a talk at GIS Day, held at the Finley Center and hosted by the North Bay GIS User Group.
Tom and Mark provided an update on the vegetation map, discussed the options for obtaining the various freely available LiDAR data products, and provided a demo of the LiDAR data.
The talk was well attended by a diverse group of GIS practitioners, planners, land managers, and scientists. It was great to hear people’s interest in the
LiDAR data and the vegetation map, as well as to learn how people are using Sonoma Veg Map data products. Thanks for coming if you attended!
And a big thanks to the organizers of GIS Day North Bay!
back to top
LiDAR Assists in Road Design
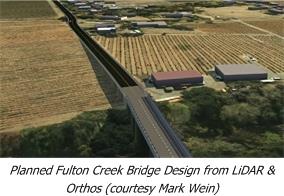
In the first of a series of blogs that highlight how the 2013 LiDAR helps people in Sonoma County do their work, we recently posted a piece about how LiDAR assists Sonoma County
engineers in road design. Mark Wein, Civil Engineer for Sonoma County’s Transportation and Public Works Department, illustrates how he is using the 2013 LiDAR point cloud to
lay out road designs and perform watershed and water drop analyses. Click here for the full post. thanks Mark!
We’d love to hear stories about how you’re using Sonoma Veg Map data and share them on our blog. Contact Tom Robinson.
back to top
Vegetation Classification Work
A brain trust of California vegetation ecologists has started the process of developing the vegetation classification that will ultimately be used
to define the classes of our Vegetation and Habitat Map. Led by Dr. Todd Keeler Wolf, this team is a collaboration between the California Department of
Fish and Game’s Vegetation Classification and Mapping Program, the California Native Plant Society, Sonoma County ecology firm Prunuske Chatham, Inc., and other
Sonoma Veg Map technical advisors.
The team is in the midst of analyzing over 1,400 vegetation plots, the majority of them collected in the last two years. Using advanced statistical
techniques such as clustering and ordination, the ecologists will develop a classification, a dichotomous key, and type descriptions.
These three items, along with the body of plot data that underpins them, will be used for all phases of the vegetation mapping process,
as well as for vegetation map accuracy assessment.
The first draft of the vegetation classification will be complete this spring. Much of this work is being done as part of an in-kind grant from the California Department of Fish and Wildlife.
back to top
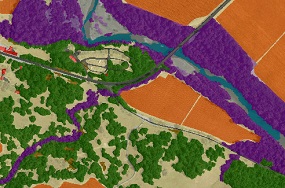
Lifeform Mapping Ramps Up
The mapping team has incorporated the 2013 LiDAR data and orthophotography into the vegetation mapping process.
The lifeform map - a map of cover type - is the next major product of the program and will be completed by Summer 2015.
The lifeform map serves as the foundation for the much more detailed fine-scale vegetation map.
After input on our lifeform pilot map from the Vegetation Mapping and Remote Sensing Advisory Committee , the mapping team spent
much of the fall making final methodological improvements to the lifeform mapping workflow. The team has now begun work on elements of the
lifeform map and is finalizing methods to go into full map production in mid-January.
To learn more about the lifeform map, check out this
post about our mapping process.
back to top
|