|
|
|
Winter Newsletter and Data Announcement - March 9, 2016
|
|
|
|
|
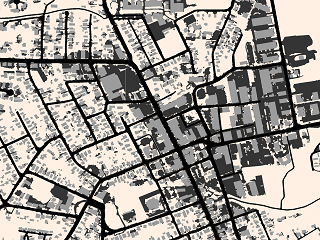
Impervious Surfaces Map Now Available
The impervious surface map serves as a fine-scale representation of
all artificial impervious surfaces in Sonoma County. Map classes in this vector (polygon) dataset include
'Paved Roads,' 'Dirt and Gravel Roads,' 'Other Impervious,' and 'Buildings'.
This dataset will provide useful information to water managers, hydrologists,
land use planners, and scientists.
The impervious surfaces data was produced by Dr. Jarlath O'Neil-Dunne and his team
at the University of Vermont. Working with Sonoma Veg Map lead consultant, Tukman Geospatial, the UVM team used a semiautomated
'expert systems' approach to produce the impervious surface map.
Impervious Surfaces Product Datasheet
Impervious Surfaces File Geodatabase
Sonoma Veg Map Data Downloads Page
|
|
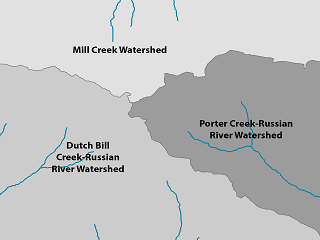
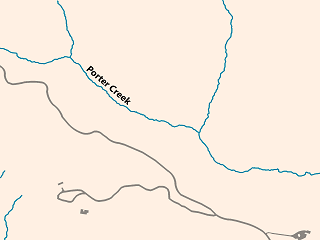
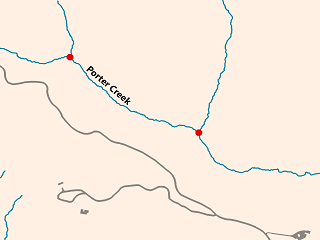
LiDAR-Derived Streams Now Available
The LiDAR derived stream centerlines represent the lowest elevation (the 'thalwag') of stream channels countywide.
Since they are LiDAR-derived, they offer a
very fine-scale representation of the county's stream network. Stream centerline naming conventions
follow the National Hydrography Dataset (NHD) flowlines.
These centerlines and the hydrologic datasets listed below are a mostly-automated first step in the eventual development of a 'localized'
or 'LiDAR enhanced' National Hydrography Dataset (NHD). The datasets will be refined over time; at this time they are suitable for landscape level planning and hydrologic modeling.
Hydro Products Datasheet
Blog Post on Hydro Products
Webmap (HUC 12 Watersheds & Centerlines)
Download Vector Hydro Products File GDB
|
|
|
|
|
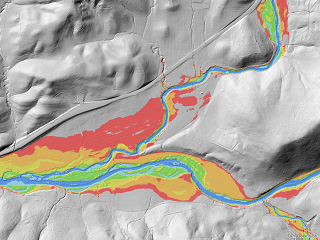
LiDAR Derived Hydro-Enforced DEM Now Available
Hydroenforcement of a DEM imparts the true elevations of culverts, pipelines, and other buried passages for water
into a Digital Elevation Model, creating a DEM suitable for modeling the flow of surface water.
A hydroenforced DEM is a prerequisite for accurate flood zone modeling, dam breach modeling, riparian zone modeling/mapping, and
many other types of hydrologic modeling. This is an initial product and will be refined over time.
Hydro Products Datasheet
Blog Post on Hydro Products
Watershed Downloads
|
|
|
|
|
Confluence Points and Hydroenforcement Burn Locations Now Available
Stream confluence points represent the locations of confluences in the new stream centerlines layer.
Hydroenforcement burn locations are lines that depict areas where hydroenforcement occurred - mostly at the locations of culverts.
There are over 35,000 of these burn locations countywide.
Hydro Products Datasheet
Blog Post on Hydro Products
Download Vector Hydro Products File GDB
|
|
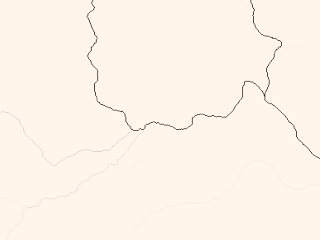
Countywide Flow Accumulation and Flow Direction Rasters Now Available
Flow accumulation and flow direction rasters are available as 1-meter resolution countywide rasters.
In the flow accumulation raster, pixel values represent the number of pixels that flow into a given pixel,
essentially providing a value for upstream catchment area. Pixels with high flow accumulation represent
areas of flow concentration (such as streams).
Flow direction provides the direction that water flows off of a pixel. Pixels contain 1 of eight values,
each representing a direction. Pixels with 'No Data' values represent sinks on the landscape.
Hydro Products Datasheet
Blog Post on Hydro Products
Watershed Downloads
|
|
|
|
|
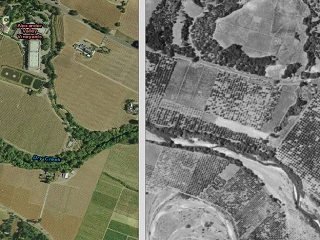
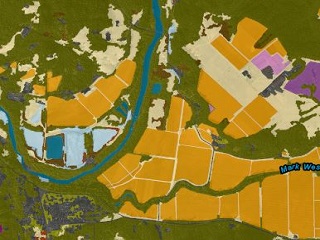
Dry Creek Area Added to 1942 Viewer
We recently expanded our 1942 image service with images from the Dry Creek area. The 1942
imagery can be viewed on our 1942 Story Map,
which is a fun way to interactively investigate changes in the Sonoma County landscape over the past 70 years.
In the next several months, new areas of imagery will be added to the 1942 mosaic for the Mark West Creek watershed
and the Petaluma River. Thanks to the Sonoma County Water Agency and the San Francisco Estuary Intitute (SFEI) for digitizing the Dry Creek imagery!
The expanded 1942 imagery can be downloaded as a SID image here.
|
|
Lifeform Map Expanded to Include Lake Sonoma Watershed in Mendocino County
The lifeform map has been expanded and now includes the Lake Sonoma watershed of Mendocino County.
The lifeform map is available from the Sonoma Veg Map data downloads page.
|
|
|
|
|
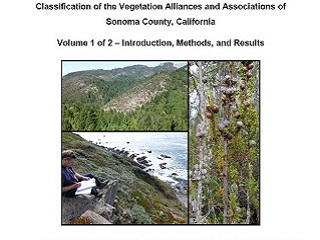
Department of Fish and Wildlife Publishes Sonoma County Vegetation Report
Sonoma Veg Map is thrilled to announce that the Department of Fish and Wildlife, in collaboration with the California Native Plant
Society, has just released a comprehensive report that includes the floristic
classification of Sonoma County's vegetation types, as well as detailed
descriptions of each type. This work is critical to the vegetation mapping effort.
Thanks to Todd Keeler-Wolf, Anne Klein, Diana Hickson, Julie Evens and the rest of the VegCAMP/CNPS team for the great work!
The report is available here:
Volume 1 - Introduction, Methods and Results
Volume 2 - Vegetation Descriptions
|

|
Thanks Tom Robinson!
Join us in saying farewell and good luck to Tom Robinson, who left the Sonoma County Agricultural Preservation and Open Space District in
February after 13 years of service. Tom's vision and hard work made Sonoma Veg Map a reality. Tom – thanks for your dedication to high quality data,
your hard work, and your collaborative spirit. We wish you all the best!!!
|
|
|
|
Sonoma County Lidar and Ortho-imagery Value Survey
NASA’s Carbon Monitoring System (CMS) Applications Effort and the Sonoma County Agriculture and Open Space District - in partnership with Sonoma County Water Agency and the Sonoma County Information Systems Department - are
interested in understanding the value of the county’s ortho-imagery and lidar imagery and products
which are available for download at http://sonomavegmap.org,
http://opentopography.org,
and https://coast.noaa.gov.
Please take a few minutes to complete this brief survey which
will aid both the NASA CMS Initiative and will help Sonoma County demonstrate the value of its imagery and data products. Thank you!
|
|
|
|