Draft Sonoma County Croplands Map Available!
We are thrilled to announce the release a draft version of one of our initial data products – the Sonoma County Croplands map.
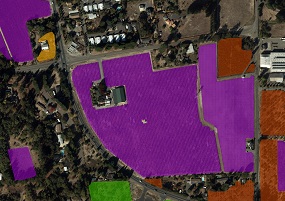
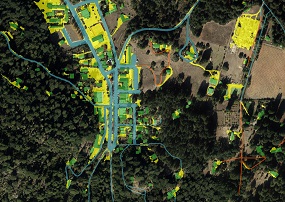
The croplands data provides a countywide fine-scale polygon map of perennial croplands, annual
croplands, nurseries, orchards/groves, and vineyards. The croplands were mapped by image analysts using aerial photographs
as ground reference and represent the state of agricultural landscape in 2013. Although the Sonoma Veg Map team will
continue to make final refinements to the map through summer, 2015, we wanted to provide the community with access to this draft now.
The final dataset will be released in fall, 2015 as the first product of the lifeform map
(another initial product of the Sonoma County Vegetation Mapping and LiDAR Program).
Built on many years of work by many hands, the croplands data evolved from the “agricultural fields” dataset that has a
long lineage and many contributors, including Circuit Rider Productions, Dr. Adina Merenlender’s Lab (UC Berkeley),
the Agricultural Preservation and Open Space District, and the Sonoma County Water Agency. During the past six months,
the Sonoma Veg Map mapping team has further improved and standardized the data, adding hundreds of new polygons and
refining the majority of existing ones.
Obtain the data as a feature service
or download a feature class or
shapefile (click "OPEN->Download" ). For more
information on the draft croplands map, check out this datasheet.
back to top
Lifeform Mapping Progressing Well
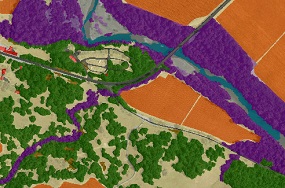
Production of the lifeform map is underway. Our computers and map editors are busy delineating and verifying vegetation patches.
Lifeform mapping is semiautomated, with the computer doing the upfront legwork. The automated part of the workflow uses a computer system
that attempts to mimic human recognition of landscape features, also called an ‘expert systems’ approach, saving hundreds of hours of manual mapping.
Although this stage involves no human interaction, it does require about 2,500 hours of computer processing time to crunch a million acres worth of LiDAR data,
imagery and other environmental datasets. The initial computer output is manually corrected by a team of mapping technicians.
At this time, the lifeform mapping effort is about 35% complete and is expected to be ready for release in late summer 2015.
For more information on the mapping methods for the lifeform map, see this blog post.
back to top
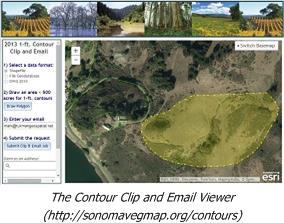
Javascript Viewers Make Obtaining Data Easy
Late last year, we released our contour clip and email viewer, which provides easy access to the countywide 1-foot LiDAR derived contours.
We recently released a second viewer, our image clip and email viewer, to facilitate access to Sonoma County orthophotography and LiDAR-derived rasters such as
hillshades, DEMs, LiDAR intensity images, and forest height rasters.
These simple viewers provide free access to contour and image data pre-clipped to your project area – you define the area on a map and a few minutes later
receive an email with a link to download your clipped data. The viewers provide data for areas up to 500 acres
(use the download by watershed option at http://sonomavegmap.org/data-downloads for larger areas).
We are excited to see and hear that these viewers are being used regularly by a wide variety of users throughout the region.
We would like to thank Dr. Maggi Kelly and the Geospatial Innovation Facility at UC Berkeley for providing the computing horsepower behind the image clip and email viewer.
back to top
Dr. Jarlath O’Neil Dunne to Produce Impervious Surface Map
Late this summer, Sonoma Veg Map will release the countywide impervious surface map along with the lifeform map.
The impervious surface map will provide a fine-scale representation of all manmade impervious surfaces in the county.
This data will provide useful information to water managers, hydrologists, planners, and scientists, and will be embedded
in the fine-scale vegetation map due out next year. Below are example uses of impervious surface layers in addressing societal challenges:
- Analyzing impacts of land development on water quality, groundwater reserves, and fish habitat
- Modeling stormwater flood potential
- Mapping habitat fragmentation
There are many ways to map impervious surfaces. We are pleased to be working with LiDAR and impervious surface mapping expert,
Dr. Jarlath O’Neil-Dunne. Working with Sonoma Veg Map lead consultant, Tukman Geospatial, Dr. O’Neil-Dunne and his team at the University of
Vermont will use a semiautomated 'expert systems' approach to produce the impervious surface map. Having mapped impervious surfaces across hundreds of millions of acres,
Dr. O’Neil-Dunne is arguably the leading expert in impervious mapping in the U.S.
He and his team recently completed an excellent impervious surface and tree canopy mapping project for the City of San Jose.
We are thrilled Dr. O’Neil-Dunne has joined the Sonoma Veg Map team.
back to top
Visit Our Blog!
Check out our Blog! Recent items include a post and accompanying story map
about how LiDAR has improved Sonoma County's road centerline mapping. A second new blog post highlights ways that managers at the Sonoma County Water Agency have used LiDAR to help restore riparian vegetation.
back to top
|