The Sonoma County Vegetation and Habitat Mapping Program will use a state of the art mapping approach that combines on the ground field data collection with modern semi-automated mapping techniques. The semi-automated approach leverages the power of today's expert systems and machine learning algorithms to automate the mundane and laborious parts of vegetation mapping, such as delineating stand boundaries and labeling obvious features, saving valuable expert labor for the more subtle and difficult components of mapping.
Field Data Collection to Support Mapping
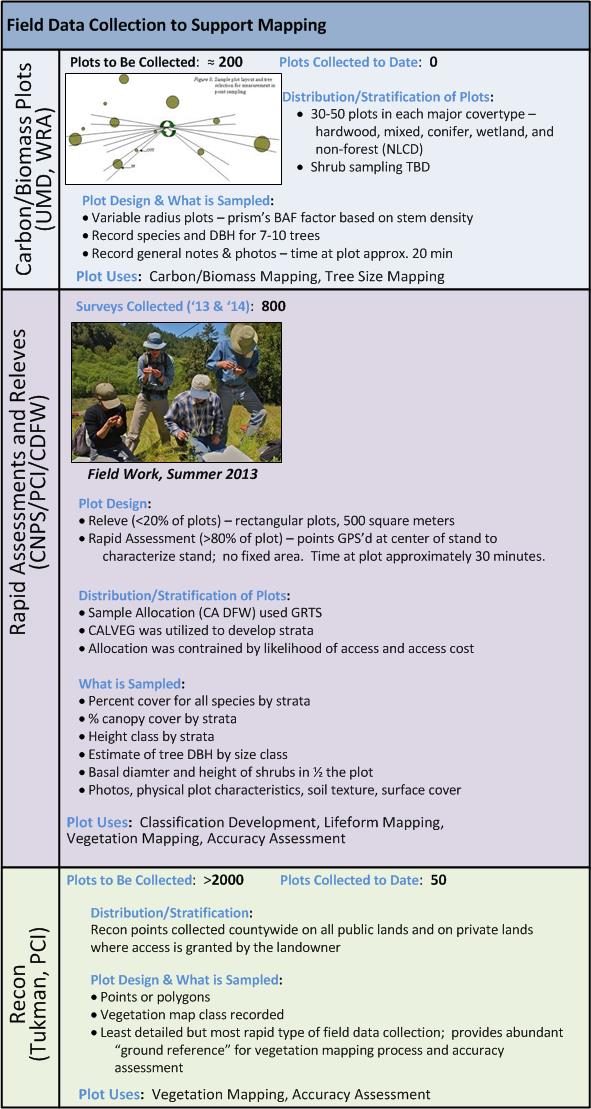
Field work is a critical component to any vegetation mapping project. As shown in Figure 1 (below), there are three types of field data that will be collected and utilized for vegetation mapping: carbon/biomass plots, rapid assessment and releve plots, and reconnaissance (recon). Variable radius plots will be collected using a prism to support the biomass and carbon mapping being conducted by Dr. Ralph Dubayah (University of Maryland) under a NASA Roses Grant. These plots will accurately measure living biomass across Sonoma County's woody habitats. The biomass measurements will be used by Dr. Dubayah's team to develop models that will be used to map woody biomass across all of Sonoma County.
Rapid assessment and releve plot collection will provide a base of very detailed species composition information across the county's habitats - these plots will be used to refine the rules and descriptions for Sonoma County's vegetation types, resulting in a classification (based on A Manual of California Vegetation), a dichotomous key, and type descriptions. The rapid assessment and releve plots - along with extensive field reconnaissance data - will be used for all phases of the vegetation mapping process, as well as for accuracy assessment. Sonoma Veg Map is lucky to be the beneficiary of an in-kind grant from the California Department of Fish and Wildlife's Vegetation Mapping and Classification Program (VegCAMP). VegCAMP, led by Dr. Todd Keeler-Wolf, has played and will continue to play an instrumental role in field data collection, plot data analysis, and classification development for Sonoma Veg Map.
Figure 1 - Field Data Collection

Lifeform Mapping
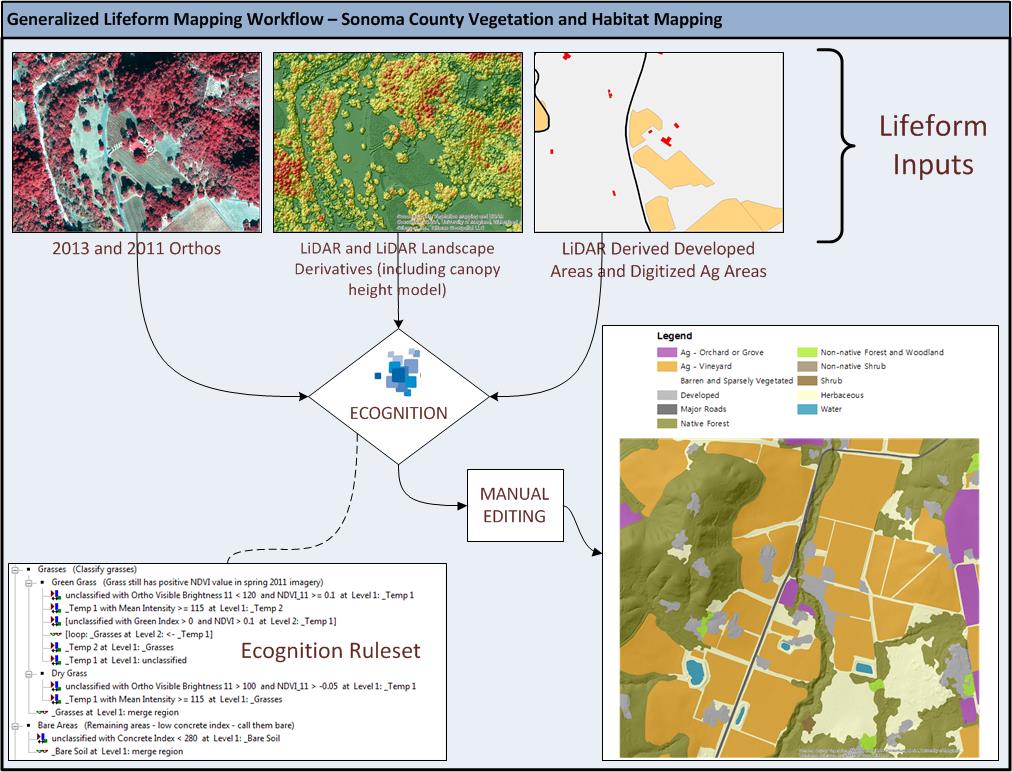
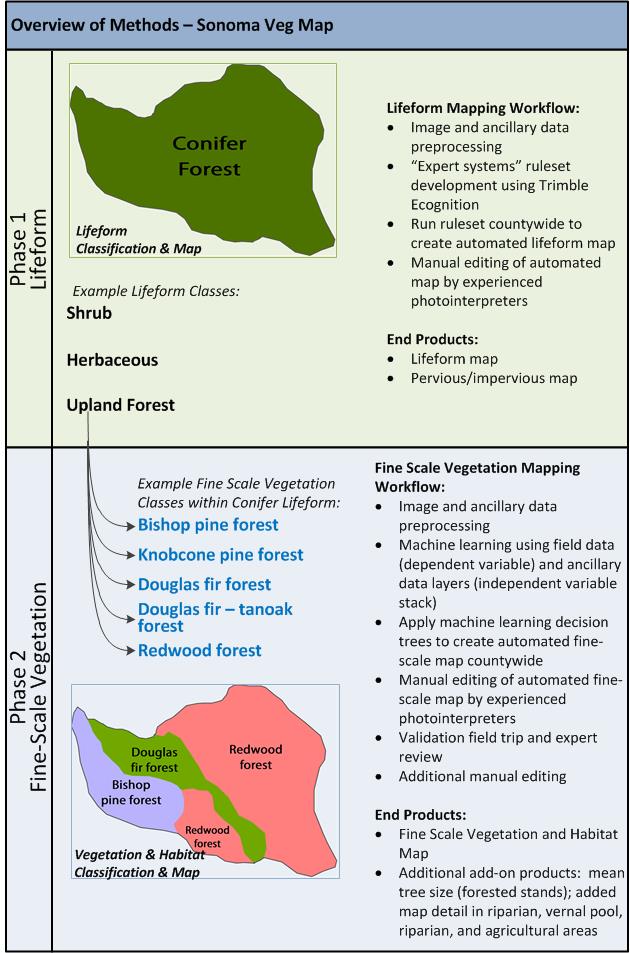
Mapping will occur in two phases: lifeform mapping and fine-scale vegetation mapping (see Figure 3 at the end of this post). The lifeform map serves as the foundation for the much more detailed fine-scale vegetation map. The lifeform map utilizes "expert systems" rulesets that are developed in Trimble Ecognition. These rulesets combine automated image segmentation (stand delineation) with object based image classification techniques. In contrast with machine learning approaches, expert systems rulesets are developed heuristically based on the knowledge of experienced image analysts. Key data sets that will be used in the expert systems rulesets for lifeform include: orthophotography ('11 and '13), the LiDAR derived Canopy Height Model (CHM), and other LiDAR derived landscape metrics. Figure 2 shows the lifeform mapping workflow.
After it is produced using Ecognition, the preliminary lifeform map product is manually edited by photointerpreters. Manual editing corrects errors where the automated methods produced incorrect results. Edits are made to correct two types of errors: 1) unsatisfactory polygon (stand) delineations and 2) incorrect polygon labels.
The lifeform map classifies the landscape into the following basic cover type classes:
- Urban Window
- Water
- Barren & Sparsely Vegetated
- Major Road
- Developed
- Orchard or Grove
- Vineyard
- Vineyard Replant
- Annual Cropland
- Perennial Agriculture
- Irrigated Pasture
- Intensively Managed Hayfield
- Nursery or Ornamental Horticultural Area
- Native Forest
- Non-Native Forest
- Shrub
- Non-Native Shrub
- Herbaceous
The impervious surface map, a separate Sonoma Veg Map product, will provide very detailed delineations of impervious surfaces, with a minimum mapping unit of 1000 square feet. Impervious surfaces will be mapped using the following classes:
- Buildings
- Dirt and Gravel Roads
- Paved Roads
- Other Impervious
Figure 2 - Lifeform Mapping Workflow

Fine-Scale Vegetation Mapping
The second phase of mapping refines the lifeform product into a fine-scale vegetation map. This process relies on machine learning algorithms which identify and exploit correlations between field surveyed vegetation and a "stack" of independent variables derived from ancillary geospatial data sets. The resulting machine-learning-based model is applied to the entire landscape, resulting in a preliminary fine-scale vegetation map. Machine learning algorithms utilized for this process will include Classification and Regression Tree Analysis (CART) and Random Forests. The independent variables used for this project will include the following:
- Spectral bands and indices (means and stand deviations) derived from 2011 and 2013 orthophotography
- Spectral bands and indices derived from multi-temporal Landsat imagery
- Key spectral indices from AVIRIS (hyperspectral) - Thanks Dr. Matthew Clark for access to this data!
- Canopy volume profiles derived from the LiDAR point cloud
- LiDAR derived slope and aspect
- LiDAR derived elevation
- LiDAR derived landscape metrics
- MODIS-derived fog/cloud frequency (thanks to Dr. Eric Waller for providing this data set!)
- Shape indices that characterize stand shape, derived from Trimble Ecognition
- Numerous layers from the California Basin Characterization Model (BCM), including average annual precipitation and climate water deficit
- Horizontal distance from coastline
After it is produced the machine learning approach, the preliminary fine scale vegetation map product is manually edited by photointerpreters. Manual editing corrects errors where the automated methods produced incorrect results. Edits are made to correct two types of errors: 1) unsatisfactory polygon (stand) delineations and 2) incorrect polygon labels. After an initial round of editing is complete, draft maps are reviewed by local experts and field crews are dispatched for a final round of map review. Based on input from local experts and notes from the final map review, the fine-scale vegetation map is manually edited one final time before delivery.

