On May 21st, the Open Space District and the Sonoma County Water Agency hosted the LiDAR and Environmental Data Forum. The forum included a number of mapping and remote sensing experts to discuss the benefits and applications of LiDAR and other high-resolution environmental data products being developed for the Sonoma County Vegetation Mapping and LiDAR Program. Speakers discussed LiDAR's role in providing next generation data products for engineering, feature extraction, vegetation mapping, and land management.
The table below lists the speakers and provides links to their presentations. For general information on LiDAR's benefits, visit this blog post.
Benefits and Applications The benefits of LiDAR for land and water management, planning and engineering are wide ranging. The following discussion demonstrates some of these benefits as they apply to Sonoma County.
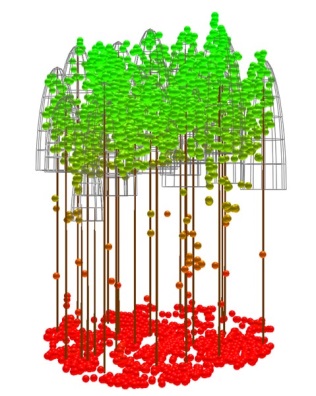
Forest Management and Measuring Forest Carbon LiDAR data is used to create automated forest structure metrics, such as tree height and canopy density. Forest structure metrics can be combined with forest plot data to produce accurate models of forest biomass and aboveground carbon sequestration. Read this 2010 New York Times article titled "New Map Shows Measuring Carbon in Amazon Is Feasible." See the videos at the bottom of this post for more on using LiDAR for forest management, forest inventory and biomass mapping.
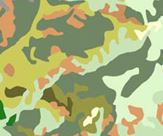
Vegetation and Habitat Mapping One of the main products of the Sonoma County Vegetation Mapping and LiDAR program will be a fine scale vegetation and habitat map of the entire county. Mapping vegetation involves developing a classification of the county's vegetation types, interpreting aerial photographs and imagery using human interpreters and computer algorithms, and verifying vegetation characteristics in the field. LiDAR data is extremely useful for vegetation & habitat mapping, as well as riparian area mapping and crop type mapping.
PG&E and other utilities periodically collect LiDAR data for their transmission lines. One major application of this data is to target danger trees for removal. If a danger tree falls in the direction of a high voltage line, it could hit and damage the line or start a wildfire. Danger trees are identified by combining LiDAR derived tree height & location information with LiDAR derived line height & location information.
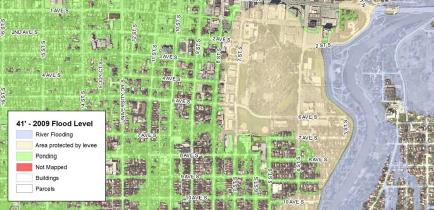
Floodplain Mapping, Flood and Tsunami Inundation Modeling Highly accurate digital elevation data is a prerequisite for accurate floodplain mapping and flood inundation modeling (from river flooding, tsunami, or storm surge). High resolution LiDAR-based DEMS greatly improve the accuracy of flood mapping.
Using LiDAR data, a team of researchers from the College of Staten Island successfully predicted coastal inundation extent resulting from Hurricane Sandy. An article in the February 13, 2013 New Yorker Magazine states "The C.S.I. study had predicted the extent of flooding uncannily-the projected flood zone proved to be accurate to the street, and almost to the house." Click here for the New Yorker article.
Read this article about flood management and planning in the Red River Basin of the North Dakota.
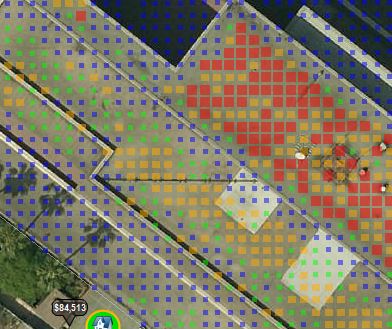
Calculating Solar Power Potential for a Roof Top or Land Parcel SCEIP (the Sonoma County Energy Independence Program) has funded 1750 residential and 57 commercial installations of solar energy since it started in the late 2000's. It provides low cost loans that pay for the system; the homeowner or business owner pays the loan back as part of their property taxes. LiDAR data provides very accurate roof pitch and roof aspect information for entire areas, as well as information that can be used to predict roof shadedness. The City and County of LA's Solar Map and Green Planning Tool is underpinned by LiDAR data. Estimating solar potential of roofs and vacant lots using LiDAR data has become a big business. Read the May, 2011 article from Forbes Magazine titled "How Much Energy Can Your Roof Generate." See the second half of the article for the LiDAR related discussion. New York City has also recently collected LiDAR data and used the data to map rooftop solar potential. This effort is described in a New York Times article where the NYC Deputy Mayor of Operations is quoted as saying, "the quality of the LiDAR information is so remarkable that it will much more rapidly unlock usable sites."
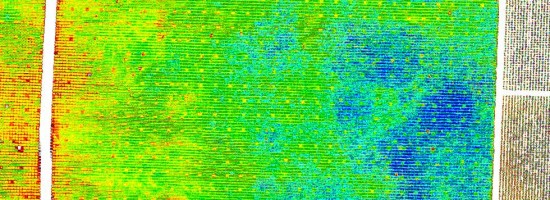
Precision Agriculture and Crop Planning LiDAR is used to create very accurate DEMs and contours that characterize the landscape in a much more refined and detailed way than 10-meter USGS DEMs. The ability to map micro topography is important for crop planning. For example, vineyard managers use topographic maps (and other data) to divide a vineyard into zones based on physical site properties, climate, and soil type. LiDAR data will produce far more accurate depictions of topography than what is available today.
Elevation Contours and DEMs Digital Elevation Models (DEMS) are produced from LiDAR data at a much higher resolution than USGS DEMS. LiDAR produces elevation models of the terrain at ground level as well as at the highest surface (buildings & tree canopy). LiDAR data is capable of producing 1 foot elevation contours.
Potential beneficiaries of high resolution DEMs and 1 foot contours in Sonoma County include city and county planning departments, land managers, farmers, builders, and engineering firms.
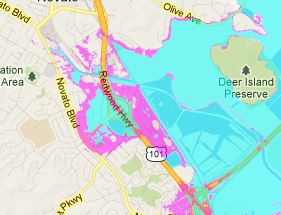
Monitoring the Effects of Sea Level Rise Sea level rise will affect Sonoma County along the Pacific Coast and in areas adjacent to the tidal wetlands of Southern Sonoma County. LiDAR data (combined with accurate bathymetric data and advanced modeling techniques) produces very accurate projections of coastal inundation as a result of storm surge and/or sea level rise. County planners and the California Department of Transportation (CalTrans) will benefit from LiDAR data when planning for the effects of sea level rise on the Sonoma County baylands and on Highway 37 in southern Sonoma County.
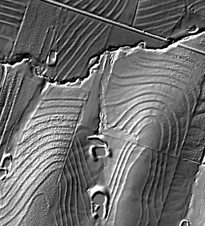
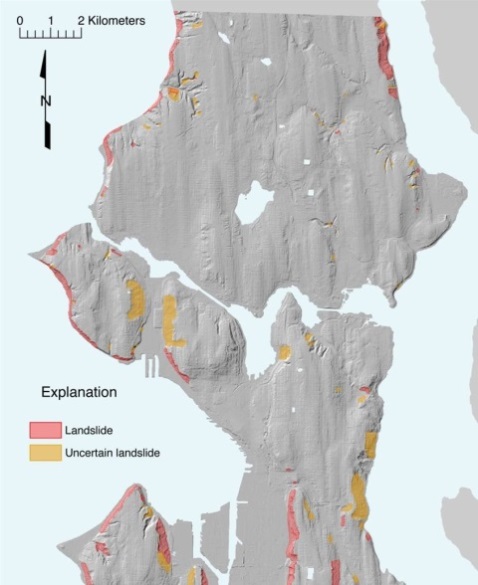
Landslide & Fault Detection and Mapping Since LiDAR penetrates the tree canopy, creating a very detailed model of the bare earth surface, LiDAR is a valuable tool for mapping faults, landslides, and debris flows - especially those obscured by vegetation. LiDAR is also used to produce landslide susceptibility maps. See the video at the end of this post from the Southern California Earthquake Center - it provides an overview of LiDAR and how it is used to identify and map earthquake faults.
Engineering Planning LiDAR produces very detailed contours and elevation models useful for engineering planning. Uses include transmission corridor and pipeline planning, storm water modeling, drainage analysis, cut and fill analysis, master planning, grading, erosion control, and roadway design. LiDAR is very effective for and for evaluating the relative merits of alternative sites for a project.
LiDAR is used in numerous water related engineering planning activities such as diversion channel routing, hydraulic analysis, flood control impoundment planning, cut and fill analysis, and 3D project visualization. High resolution topographic data (usually derived from LiDAR) is necessary for flood inundation mapping. Dam breach analysis and resulting flood inundation mapping often relies on LiDAR data, which provides much more accurate results than analysis using 10 meter USGS DEMs.
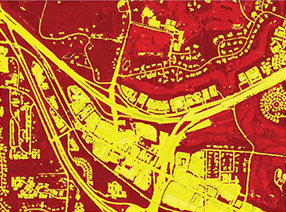
Pervious/Impervious Surface Mapping
LiDAR data aids in the effective mapping of pervious and impervious areas across a landscape. Maps of pervious and impervious surfaces are useful for managing and modeling stormwater runoff, hydrologic modeling, habitat modeling, and urban planning.
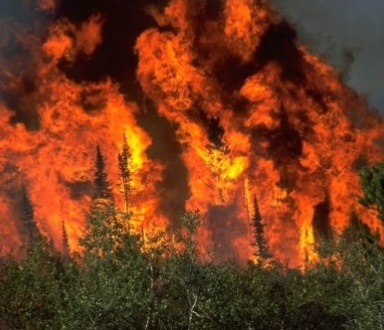
Fuel Mapping and Fire Hazard Modeling
Because it depicts the forest in three dimensions, LiDAR data improves the accuracy of fuel maps and increases the accuracy of fire risk and fire behavior models. LiDAR is increasingly used by state and federal agencies to assist in mapping fuels, fire risk, and fire behavior.
Videos that Demonstrate Some of LiDAR's Benefits
Watch the ESRI Video Below, entitled "Improving Operational Planning Using Forest Inventories and GIS"
The video below from the Southern California Earthquake Center provides an overview of LiDAR and how it is used to identify and map earthquake faults.
Watch the video below from the United States Forest Service titled "Modeling Biomass and Canopy Fuel Attributes Using LiDAR"
Watch the "Introduction to LiDAR" video below from ASPRS (American Society of Photogrammetry and Remote Sensing)
Course information (including lecture materials) for Penn State's "LiDAR Technology and Applications" Course (Geography 497D). See the course outline (bottom left) for access to lecture materials and readings.
NOAA Coastal Service's Center Digital Coast web site for downloading LiDAR data and other coastal datasets. The web site includes access to the 2009-2011 LiDAR collection (2 pts./square meter) that includes coastal areas of Sonoma County.
The Vegetation Mapping Program kick off meeting was held on December 13th at the Agricultural Preservation and Open Space District office in Santa Rosa. Thanks for the great turnout! The meeting provided an opportunity to get the word out on the mapping program and to hear ideas and input from map stakeholders and potential end users. Tom Robinson, the mapping program manager, outlined the goals of the program, introduced the mapping team, discussed program development/fundraising, and reviewed ways to get involved. Mark Tukman, the mapping team project manager, presented the Vegetation Mapping and Remote Sensing Advisory Committee and reviewed the technical mapping approach. A question and answer session followed the presentation.
The kickoff was attended by numerous stakeholders and vegetation and habitat map end users. Attendees represented numerous groups and organizations, including the following:
AECOM
Audubon Canyon Ranch
Baseline Consulting
Botanical and Ecological Consulting
California Coastal Conservancy
California Dept. of Fish and Wildlife
California Dept. of Forestry and Fire Protection
City of Santa Rosa
County of Sonoma Permit and Resource Management Department
Open Space District Citizen's Advisory Committee
LandPaths
Marin County Parks and Open Space Department
NOAA - National Marine Fisheries
Ocean Song Farm & Wilderness
Pepperwood Preserve
Planet Horticulture
Private Landowners
Prunuske Chatham Inc.
San Francisco Bay Joint Venture
San Francisco Estuary Institute
Sonoma County Regional Parks
Sonoma County Water Agency
Sonoma County Winegrape Commission
Sonoma Ecology Center
Sonoma Land Trust
Sonoma State University
United Winegrowers for Sonoma County
Wine Country Group Real Estate
Environmental Planning and Engineering Firms
The slides from our kick off presentation are available here. Audio of the meeting and video of the accompanying slides is provided below via YouTube. Notes from the question and answer session can be viewed here.
Sonoma County has numerous dates of countywide imagery available for public use. The vegetation mapping program will benefit greatly from the imagery throughout our mapping process. All image services are hosted by by the Sonoma County Information Services Department; some are also hosted by the University of California. Thanks to Tim Pudoff and his team at Sonoma County ISD and Dr. Maggi Kelly, Nancy Thomas and the Geospatial Innovation Facility (GIF) at the University of California, Berkeley! Image services can be accessed using ESRI products, such as ArcMap and ArcGIS Online.
To add these services in ArcMap, go to "Add Data from ArcGIS Online" and search for "Sonoma County Imagery". Or send a membership request to join the Sonoma County Imagery Group to make accessing these services easy from within ESRI products. The gallery below shows the current set of image services available in the Sonoma County Imagery Group.
Serpentine communities occur in scattered areas across Sonoma County. These communities support a number of rare and endangered plant species. From a vegetation mapping perspective, these are important areas. Because thesy are small, geographically isolated, and occur uncommonly across the County's landscape, it will be important to clearly identify these areas and compile existing field data for them before our mapping work begins. Serpentine areas on the North Coast have been studied significantly in the past 75 years, and much is known about their composition. In the April, 2009 issue of the Journal Fremontia (California Native Plant Society), Roger Raiche provides a great botanical profile of the Cedars, the county's largest serpentine area.
The serpentine areas of Sonoma County are associated with several soil types. Among these are soils from the Henneke Series, soils from the Montara series, and soils from the Huse series.
The interactive map below shows the 1997 Soil Survey Geographic (SSURGO) soils data overlaid on Bing aerial imagery. Pan and zoom to move around on the map. Access the "Bookmarks" to navigate to the major serpentine areas in the county. If you click "View Larger Map," a larger map will open in ArcGIS.com with more functionality. This map's default extent is an area of serpentine soils (mainly the Henneke series) and vegetation north of Occidental near the Bohemian Highway.
In the 1920s and 30s, forester A.E. Weislander led an effort to map vegetation across the State of California. Though never completed, this effort resulted in set of maps, photos, and vegetation plot data for numerous areas throughout California. This data set provides the best available snapshot of California vegetation during the early part of the 20th century.
The Wieslander Vegetation Type Mapping (VTM) Project, a project conducted jointly between UC Berkeley and UC Davis, has resulted in the digitization of the Wieslander plot data, photos and many of the vegetation map sheets. The VTM project was jointly funded by the US Department of Agriculture and UC Berkeley. Much of the GIS work for the Wieslander VTM project was undertaken by Dr. Maggi Kelley's laboratory at UC Berkeley. Dr. Kelley serves as an Advisory Committee member for our Vegetation Mapping Program here in Sonoma County.
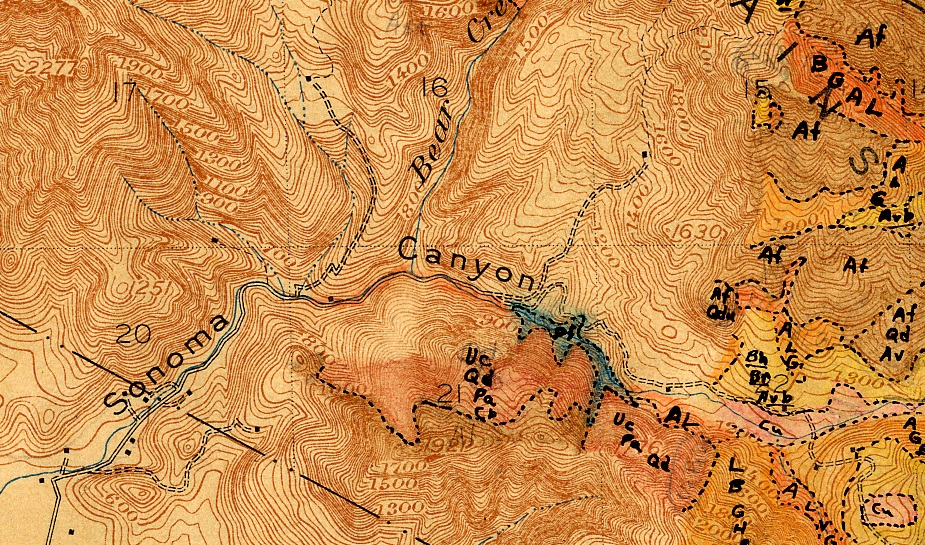
Example of a Wieslander Vegetation Map from Sonoma Valley
The Wieslander maps are of interest to the Sonoma County Vegetation Mapping Program because - once the Sonoma County map is produced - the Wieslander maps can be compared to the new Sonoma County Vegetation map to see how vegetation has changed in the past 70 years or so.
Wieslander plot data is limited to only 13 available plots in southern Sonoma County. But Wieslander vegetation maps exist for a number of areas within the county, including the far northern section of the county, and the southeastern part including the southern Mayacamas Mountains.
In addition to digitizing the vegetation related data and photos, the University of California also has captured digital transcripts of interviews conducted with A.E. Weislander in 1985. These are fascinating to read.
To download the map or the plot data for Sonoma County, go to http://vtm.berkeley.edu/data/ and click "Data by County."
Welcome to the Sonoma County Vegetation and Habitat Mapping blog! This blog will facilitate an ongoing discussion between the mapping team, the map's stakeholders, and end users of the maps. We will also use this forum to make our community aware of program related events and milestones.