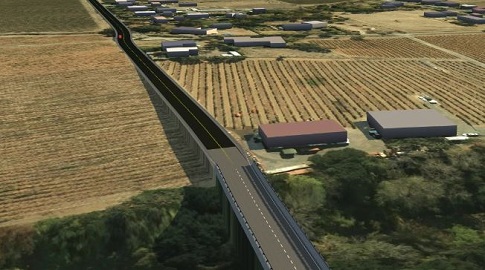
As the first in an occasional series on our blog, we're posting about how folks are using the 2013 SonomaVegMap LiDAR data. Mark Wein, Civil Engineer for Sonoma County's Department of Transportation and Public Works, uses the LiDAR point cloud to help when designing new roads and bridges. Mark uses Autodesk products to create triangulated area networks (TINS) from the point cloud. The software provides Mark with advanced point cloud filtering options that give him the ability to create his own customized ground surface TINs for a project area.
Mark brings the resulting ground surface TINs into AutoCAD (Civil 3D 2013) to create a preliminary design. Mark says "I really enjoy how fast it is to take the point cloud, create a TIN surface, pull the surface into Infraworks, add in the SonomaVegMap orthos and buildings footprints, and layout a quick road design."
The resulting road designs and TIN surfaces help Mark and other TPW staff to design new road infrastructure and to perform watershed and water drop analysis. Thanks very much Mark for sharing your work with SonomaVegMap!
Planned Fulton Creek Bridge Design from 2013 SonomaVegMap LiDAR & Orthos (courtesy Mark Wein)
Fearing a west coast invasion during World War II, the U.S. Department of War collected airphotographs of all of Sonoma County in 1942. These photos are the earliest complete image of Sonoma County. The photos were collected on film and printed as thousands of hard copy (9" x 9") photos. Two complete hard copies remain - one at the University of California Berkeley and the other at Draftech in Santa Rosa.
Through a grant from the Sonoma County Water Agency and the Sonoma County Agricultural Preservation and Open Space District, the San Francisco Estuary Institute (SFEI) has digitized, georeferenced, and mosaiced a subset of the photos - those that comprise the Santa Rosa Plain. This dataset is useful for all manner of historical analysis such as understanding changes in land use and population, and tracking changes in vegetation and habitat over time.
Check out the embedded map below (click here for the full version) to easily compare what things looked like in 1942 to what they look like today in the Santa Rosa Plain. Watch out - it's addicting! You can also download the air photography here (700 MB .img file). If you want to use the photography as an ESRI image service, search ArcGIS.com for 'Sonoma County 1942'.
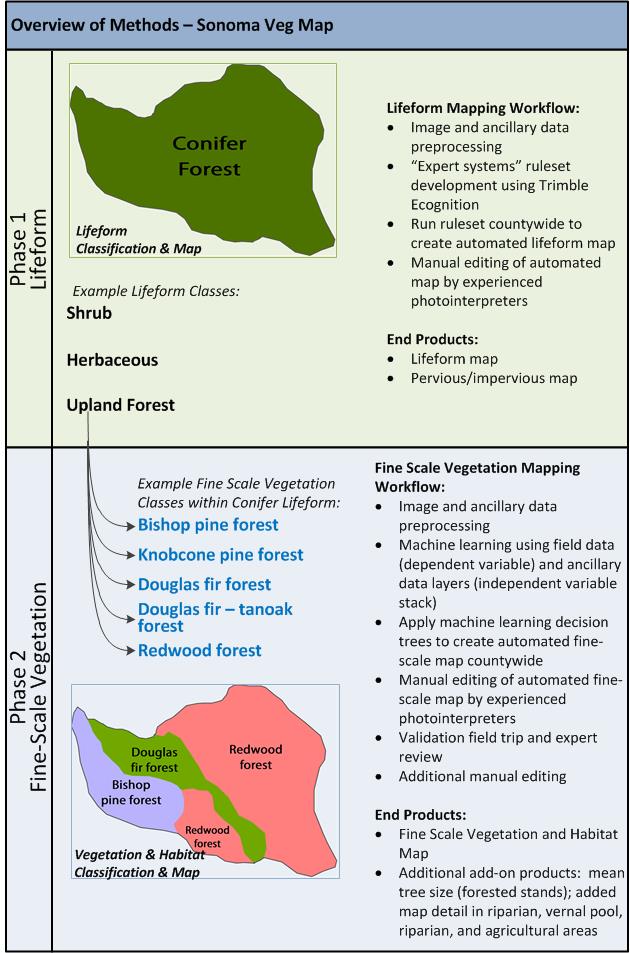
The Sonoma County Vegetation and Habitat Mapping Program will use a state of the art mapping approach that combines on the ground field data collection with modern semi-automated mapping techniques. The semi-automated approach leverages the power of today's expert systems and machine learning algorithms to automate the mundane and laborious parts of vegetation mapping, such as delineating stand boundaries and labeling obvious features, saving valuable expert labor for the more subtle and difficult components of mapping.
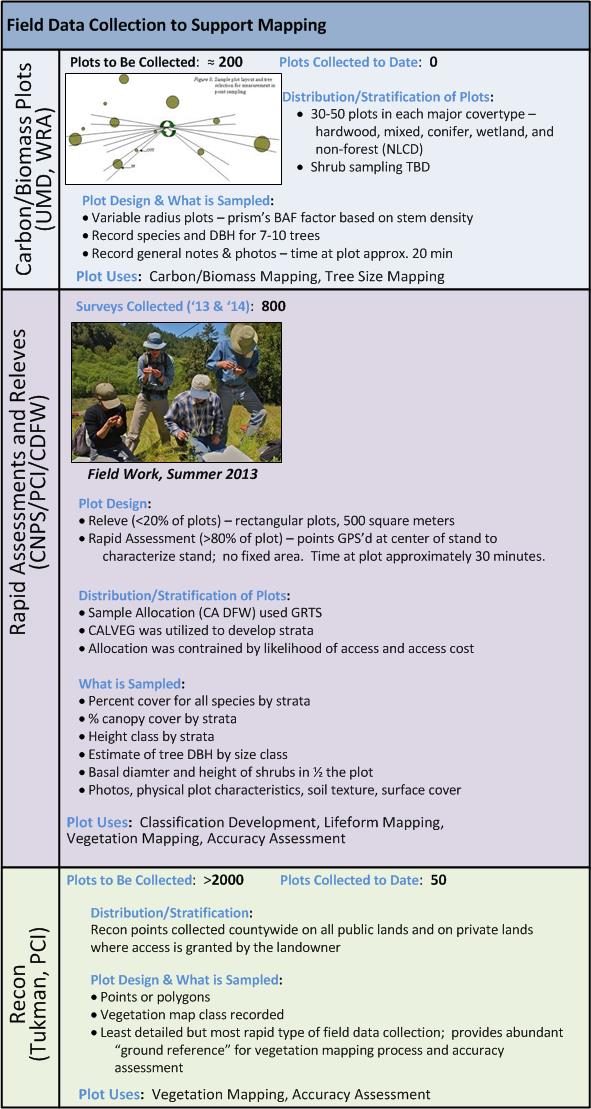
Field Data Collection to Support Mapping
Field work is a critical component to any vegetation mapping project. As shown in Figure 1 (below), there are three types of field data that will be collected and utilized for vegetation mapping: carbon/biomass plots, rapid assessment and releve plots, and reconnaissance (recon). Variable radius plots will be collected using a prism to support the biomass and carbon mapping being conducted by Dr. Ralph Dubayah (University of Maryland) under a NASA Roses Grant. These plots will accurately measure living biomass across Sonoma County's woody habitats. The biomass measurements will be used by Dr. Dubayah's team to develop models that will be used to map woody biomass across all of Sonoma County.
Rapid assessment and releve plot collection will provide a base of very detailed species composition information across the county's habitats - these plots will be used to refine the rules and descriptions for Sonoma County's vegetation types, resulting in a classification (based on A Manual of California Vegetation), a dichotomous key, and type descriptions. The rapid assessment and releve plots - along with extensive field reconnaissance data - will be used for all phases of the vegetation mapping process, as well as for accuracy assessment. Sonoma Veg Map is lucky to be the beneficiary of an in-kind grant from the California Department of Fish and Wildlife's Vegetation Mapping and Classification Program (VegCAMP). VegCAMP, led by Dr. Todd Keeler-Wolf, has played and will continue to play an instrumental role in field data collection, plot data analysis, and classification development for Sonoma Veg Map.
Figure 1 - Field Data Collection
Lifeform Mapping
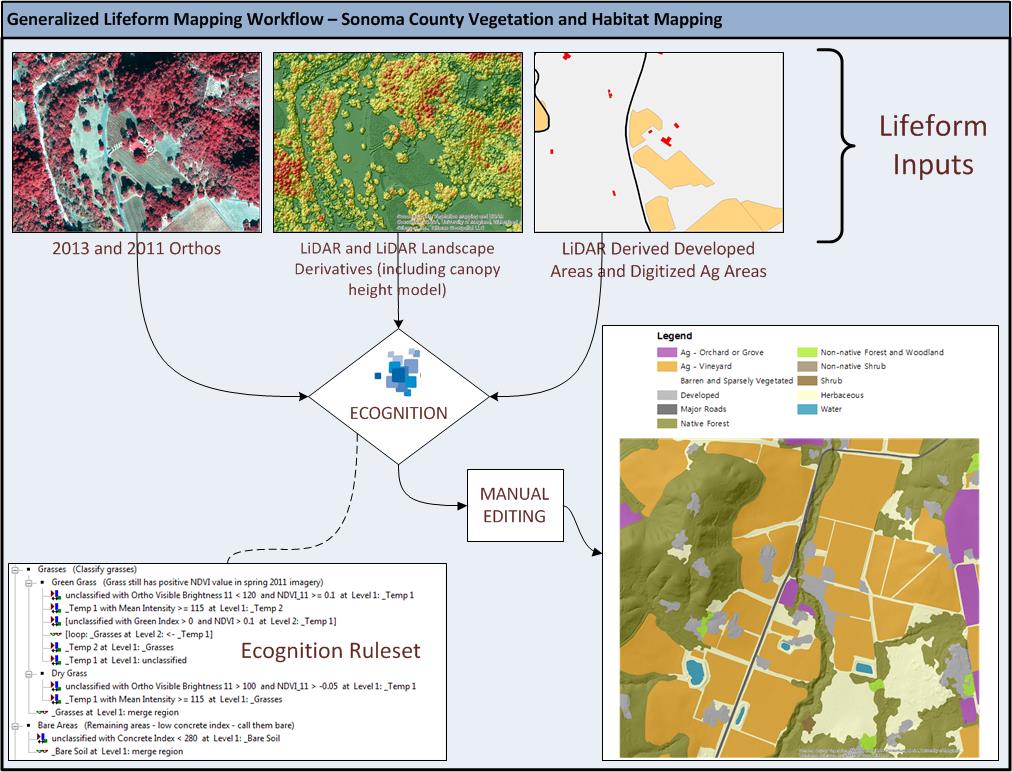
Mapping will occur in two phases: lifeform mapping and fine-scale vegetation mapping (see Figure 3 at the end of this post). The lifeform map serves as the foundation for the much more detailed fine-scale vegetation map. The lifeform map utilizes "expert systems" rulesets that are developed in Trimble Ecognition. These rulesets combine automated image segmentation (stand delineation) with object based image classification techniques. In contrast with machine learning approaches, expert systems rulesets are developed heuristically based on the knowledge of experienced image analysts. Key data sets that will be used in the expert systems rulesets for lifeform include: orthophotography ('11 and '13), the LiDAR derived Canopy Height Model (CHM), and other LiDAR derived landscape metrics. Figure 2 shows the lifeform mapping workflow.
After it is produced using Ecognition, the preliminary lifeform map product is manually edited by photointerpreters. Manual editing corrects errors where the automated methods produced incorrect results. Edits are made to correct two types of errors: 1) unsatisfactory polygon (stand) delineations and 2) incorrect polygon labels.
The lifeform map classifies the landscape into the following basic cover type classes:
Urban Window
Water
Barren & Sparsely Vegetated
Major Road
Developed
Orchard or Grove
Vineyard
Vineyard Replant
Annual Cropland
Perennial Agriculture
Irrigated Pasture
Intensively Managed Hayfield
Nursery or Ornamental Horticultural Area
Native Forest
Non-Native Forest
Shrub
Non-Native Shrub
Herbaceous
The impervious surface map, a separate Sonoma Veg Map product, will provide very detailed delineations of impervious surfaces, with a minimum mapping unit of 1000 square feet. Impervious surfaces will be mapped using the following classes:
Buildings
Dirt and Gravel Roads
Paved Roads
Other Impervious
Figure 2 - Lifeform Mapping Workflow
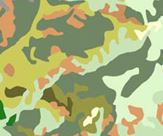
Fine-Scale Vegetation Mapping
The second phase of mapping refines the lifeform product into a fine-scale vegetation map. This process relies on machine learning algorithms which identify and exploit correlations between field surveyed vegetation and a "stack" of independent variables derived from ancillary geospatial data sets. The resulting machine-learning-based model is applied to the entire landscape, resulting in a preliminary fine-scale vegetation map. Machine learning algorithms utilized for this process will include Classification and Regression Tree Analysis (CART) and Random Forests. The independent variables used for this project will include the following:
Spectral bands and indices (means and stand deviations) derived from 2011 and 2013 orthophotography
Spectral bands and indices derived from multi-temporal Landsat imagery
Key spectral indices from AVIRIS (hyperspectral) - Thanks Dr. Matthew Clark for access to this data!
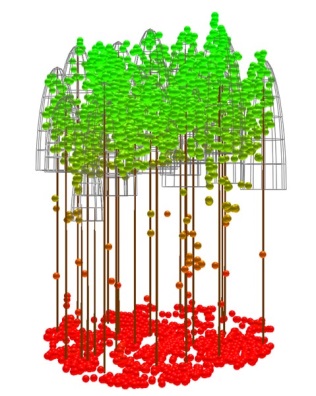
Canopy volume profiles derived from the LiDAR point cloud
LiDAR derived slope and aspect
LiDAR derived elevation
LiDAR derived landscape metrics
MODIS-derived fog/cloud frequency (thanks to Dr. Eric Waller for providing this data set!)
Shape indices that characterize stand shape, derived from Trimble Ecognition
After it is produced the machine learning approach, the preliminary fine scale vegetation map product is manually edited by photointerpreters. Manual editing corrects errors where the automated methods produced incorrect results. Edits are made to correct two types of errors: 1) unsatisfactory polygon (stand) delineations and 2) incorrect polygon labels. After an initial round of editing is complete, draft maps are reviewed by local experts and field crews are dispatched for a final round of map review. Based on input from local experts and notes from the final map review, the fine-scale vegetation map is manually edited one final time before delivery.
The Local Ecology and Botany Advisory Group - 35 experts in ecology, botany, and land management - convened at the Laguna Foundation's Heron Hall in late January to advise the vegetation and habitat mapping team. The advisory group's primary role is to provide expert local botanical and ecological insight to help make the most comprehensive, accurate, useful map possible.
The meeting began with presentations by members of the mapping team (Tom Robinson, Mark Tukman, and Joan Schwan) followed by breakout sessions. In the breakout sessions, committee members advised the mapping team on possible locations for field work, occurrences of unique or rare vegetation communities, and existing fine-scale vegetation data for use by the mapping team. Committee members also provided valuable input on strategies for maximizing the usability of the vegetation and habitat map.
Thanks to our ecologists and botanists for donating their time and expertise to help us make the best map! See below for a list of Local Ecology and Botany Advisory Group Members.
Name
Affiliation
Aaron Arthur
Consulting botanist
Ann Howald
Consulting botanist
Arthur Dawson
Baseline Consulting
Brendan O'Neil
California State Parks
Caroline Christian
Sonoma State University
Chris Kjeldsen
Consulting botanist
Christina Sloop
San Francisco Bay Joint Venture
Claudia Luke
Sonoma State University
Cyndy Shafer
California State Parks
Dave Cook
Sonoma County Water Agency
Fred Euphrat
Consulting forester
Gene Cooley
CA Department of Fish and Wildlife
Hattie Brown
Laguna Foundation
Jane Valerius
Consulting botanist
Joe Pecharich
NOAA/NMFS
John Herrick
CNPS Milo Baker Chapter
Julian Meisler
Sonoma Land Trust
Kate Symonds
USFWS, Partners for Fish & Wildlife
Kathleen Kraft
Sonoma Marin Coastal Grasslands Working Group
Keenan Foster
Sonoma County Water Agency
Liz Parsons
CNPS Milo Baker Chapter
Mariska Obedzinski
UCCE/CA Sea Grant
Michelle Halbur
Pepperwood Preserve
Peter Baye
Consulting botanist
Peter Connors
UC Davis Bodega Marine Lab
Peter Warner
Consulting botanist
Phil Northen
Sonoma State University
Phil van Soelen
Cal Flora Nursery
Rich Stabler
Sonoma County Permit and Resource Management Dept.
Roger Raiche
Planet Horticulture
Sarah Gordon
Consulting botanist, CNPS Milo Baker, project field crew
Save the Redwoods League - through its conservation planning program - has provided funding for redwood related plot data collection and analysis in Sonoma County. The funding will result in the establishment of 12 permanent plots in redwood stands across the county. Sampled stands will be selected to represent a range of moisture regimes where redwood occurs in the county—from stands along the relatively moist coastline to the relatively drier pockets of redwood forests of eastern Sonoma County. The permanent plots will be established and designed with the objective of periodic re-sampling in mind. Plots will be 400 square meters (20m x 20m). Sampling will result in an inventory of all plants in the plot, and woody vegetation will be measured.
Data from the permanent plots will be used to monitor trends in redwood forest composition over time—which is important for tracking the effects of climate change on our region's most iconic habitat type. The plot data will also be used to accurately characterize redwood forests in the Sonoma County vegetation and habitat map. These data will augment a growing body of vegetation plot data in Sonoma County being collected by the California Department of Fish and Game's Vegetation Classification and Mapping Program, the California Native Plant Society, Pepperwood Foundation, Prunuske Chatham, Inc., Sonoma State University (Dr. Matthew Clark), and the University of Maryland (Dr. Ralph Dubayah). These data will help to support the ongoing development of Sonoma County's vegetation and habitat map.
The permanent redwood plots will provide for a better understanding of redwood vegetation associations, their biotic components, and their patterns and distributions in Sonoma County. The sampling, classification, and mapping of redwood vegetation will raise awareness of their importance and rarity, identify threats to their existence, and allow for conservation of biodiversity at the "multi‐species" landscape level. Establishing a vegetation sampling array provides a scientific baseline for assessing and monitoring the overstory and understory components of redwood forests in the region. Future resampling will allow for the detection and mitigation of changes in redwood forests that may result from climate change. This project will also support other projects in the county aimed at demonstrating the value of the county's forests to carbon sequestration and other reductions in greenhouse gases.
For more information contact: Julie Evens, California Native Plant Society Lisa Micheli, Pepperwood Preserve Mark Tukman, Tukman Geospatial LLC Tom Robinson, Sonoma County Agricultural Preservation and Open Space District
The committee advises the mapping team on state-of-the art mapping techniques and methods. Dr. Golinkoff is an expert at using LiDAR to help map, measure, and manage forestland in Northern California. A Forest Carbon Analyst for the Conservation Fund, Dr. Golinkoff will add to the Advisory Committee's LiDAR and forest mapping expertise.
Dr. Golinkoff is one of the nation's leading experts on forest carbon project development, monitoring, and verification. He joined The Conservation Fund in 2005 and has extensive experience in forest inventory and projection methodologies, statistical analysis, and carbon accounting practices and standards compliance. A trained forester and Climate Action Reserve and California Air Resources Board approved verifier, Jordan is responsible for forest inventory design and carbon offset registration for The Conservation Fund, the nation's largest seller of verified forest carbon offsets. Jordan has a B.A. in Computer Science from Yale University, a Masters of Forestry from Duke University, and a Ph.D. in forest mensuration and biometrics from the University of Montana.
On May 21st, the Open Space District and the Sonoma County Water Agency hosted the LiDAR and Environmental Data Forum. The forum included a number of mapping and remote sensing experts to discuss the benefits and applications of LiDAR and other high-resolution environmental data products being developed for the Sonoma County Vegetation Mapping and LiDAR Program. Speakers discussed LiDAR's role in providing next generation data products for engineering, feature extraction, vegetation mapping, and land management.
The table below lists the speakers and provides links to their presentations. For general information on LiDAR's benefits, visit this blog post.
Benefits and Applications The benefits of LiDAR for land and water management, planning and engineering are wide ranging. The following discussion demonstrates some of these benefits as they apply to Sonoma County.
Forest Management and Measuring Forest Carbon LiDAR data is used to create automated forest structure metrics, such as tree height and canopy density. Forest structure metrics can be combined with forest plot data to produce accurate models of forest biomass and aboveground carbon sequestration. Read this 2010 New York Times article titled "New Map Shows Measuring Carbon in Amazon Is Feasible." See the videos at the bottom of this post for more on using LiDAR for forest management, forest inventory and biomass mapping.
Vegetation and Habitat Mapping One of the main products of the Sonoma County Vegetation Mapping and LiDAR program will be a fine scale vegetation and habitat map of the entire county. Mapping vegetation involves developing a classification of the county's vegetation types, interpreting aerial photographs and imagery using human interpreters and computer algorithms, and verifying vegetation characteristics in the field. LiDAR data is extremely useful for vegetation & habitat mapping, as well as riparian area mapping and crop type mapping.
PG&E and other utilities periodically collect LiDAR data for their transmission lines. One major application of this data is to target danger trees for removal. If a danger tree falls in the direction of a high voltage line, it could hit and damage the line or start a wildfire. Danger trees are identified by combining LiDAR derived tree height & location information with LiDAR derived line height & location information.
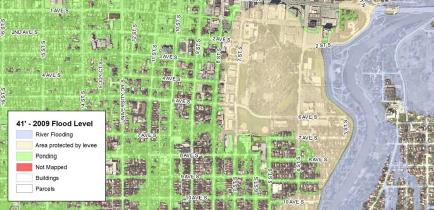
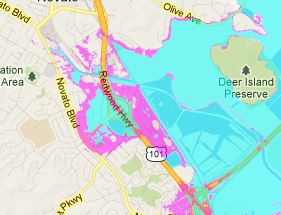
Floodplain Mapping, Flood and Tsunami Inundation Modeling Highly accurate digital elevation data is a prerequisite for accurate floodplain mapping and flood inundation modeling (from river flooding, tsunami, or storm surge). High resolution LiDAR-based DEMS greatly improve the accuracy of flood mapping.
Using LiDAR data, a team of researchers from the College of Staten Island successfully predicted coastal inundation extent resulting from Hurricane Sandy. An article in the February 13, 2013 New Yorker Magazine states "The C.S.I. study had predicted the extent of flooding uncannily-the projected flood zone proved to be accurate to the street, and almost to the house." Click here for the New Yorker article.
Read this article about flood management and planning in the Red River Basin of the North Dakota.
Calculating Solar Power Potential for a Roof Top or Land Parcel SCEIP (the Sonoma County Energy Independence Program) has funded 1750 residential and 57 commercial installations of solar energy since it started in the late 2000's. It provides low cost loans that pay for the system; the homeowner or business owner pays the loan back as part of their property taxes. LiDAR data provides very accurate roof pitch and roof aspect information for entire areas, as well as information that can be used to predict roof shadedness. The City and County of LA's Solar Map and Green Planning Tool is underpinned by LiDAR data. Estimating solar potential of roofs and vacant lots using LiDAR data has become a big business. Read the May, 2011 article from Forbes Magazine titled "How Much Energy Can Your Roof Generate." See the second half of the article for the LiDAR related discussion. New York City has also recently collected LiDAR data and used the data to map rooftop solar potential. This effort is described in a New York Times article where the NYC Deputy Mayor of Operations is quoted as saying, "the quality of the LiDAR information is so remarkable that it will much more rapidly unlock usable sites."
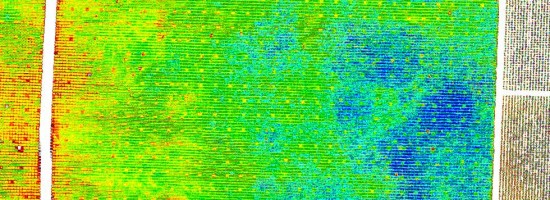
Precision Agriculture and Crop Planning LiDAR is used to create very accurate DEMs and contours that characterize the landscape in a much more refined and detailed way than 10-meter USGS DEMs. The ability to map micro topography is important for crop planning. For example, vineyard managers use topographic maps (and other data) to divide a vineyard into zones based on physical site properties, climate, and soil type. LiDAR data will produce far more accurate depictions of topography than what is available today.
Elevation Contours and DEMs Digital Elevation Models (DEMS) are produced from LiDAR data at a much higher resolution than USGS DEMS. LiDAR produces elevation models of the terrain at ground level as well as at the highest surface (buildings & tree canopy). LiDAR data is capable of producing 1 foot elevation contours.
Potential beneficiaries of high resolution DEMs and 1 foot contours in Sonoma County include city and county planning departments, land managers, farmers, builders, and engineering firms.
Monitoring the Effects of Sea Level Rise Sea level rise will affect Sonoma County along the Pacific Coast and in areas adjacent to the tidal wetlands of Southern Sonoma County. LiDAR data (combined with accurate bathymetric data and advanced modeling techniques) produces very accurate projections of coastal inundation as a result of storm surge and/or sea level rise. County planners and the California Department of Transportation (CalTrans) will benefit from LiDAR data when planning for the effects of sea level rise on the Sonoma County baylands and on Highway 37 in southern Sonoma County.
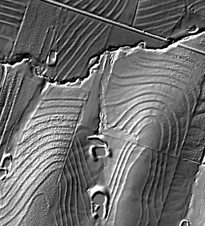
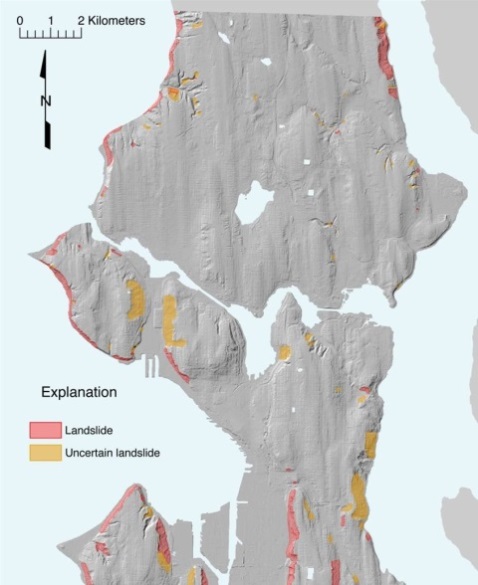
Landslide & Fault Detection and Mapping Since LiDAR penetrates the tree canopy, creating a very detailed model of the bare earth surface, LiDAR is a valuable tool for mapping faults, landslides, and debris flows - especially those obscured by vegetation. LiDAR is also used to produce landslide susceptibility maps. See the video at the end of this post from the Southern California Earthquake Center - it provides an overview of LiDAR and how it is used to identify and map earthquake faults.
Engineering Planning LiDAR produces very detailed contours and elevation models useful for engineering planning. Uses include transmission corridor and pipeline planning, storm water modeling, drainage analysis, cut and fill analysis, master planning, grading, erosion control, and roadway design. LiDAR is very effective for and for evaluating the relative merits of alternative sites for a project.
LiDAR is used in numerous water related engineering planning activities such as diversion channel routing, hydraulic analysis, flood control impoundment planning, cut and fill analysis, and 3D project visualization. High resolution topographic data (usually derived from LiDAR) is necessary for flood inundation mapping. Dam breach analysis and resulting flood inundation mapping often relies on LiDAR data, which provides much more accurate results than analysis using 10 meter USGS DEMs.
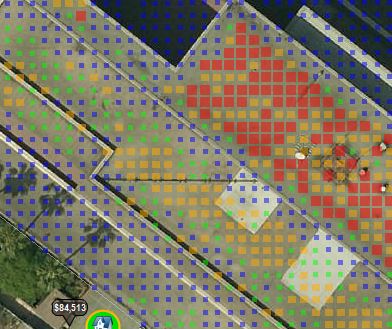
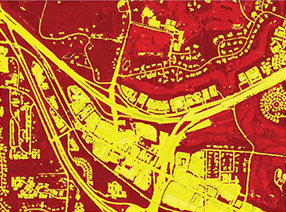
Pervious/Impervious Surface Mapping
LiDAR data aids in the effective mapping of pervious and impervious areas across a landscape. Maps of pervious and impervious surfaces are useful for managing and modeling stormwater runoff, hydrologic modeling, habitat modeling, and urban planning.
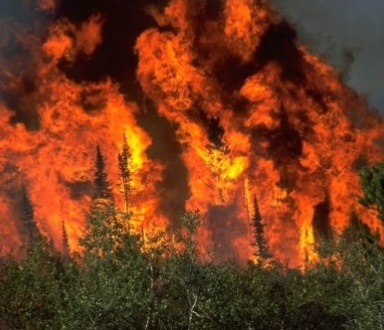
Fuel Mapping and Fire Hazard Modeling
Because it depicts the forest in three dimensions, LiDAR data improves the accuracy of fuel maps and increases the accuracy of fire risk and fire behavior models. LiDAR is increasingly used by state and federal agencies to assist in mapping fuels, fire risk, and fire behavior.
Videos that Demonstrate Some of LiDAR's Benefits
Watch the ESRI Video Below, entitled "Improving Operational Planning Using Forest Inventories and GIS"
The video below from the Southern California Earthquake Center provides an overview of LiDAR and how it is used to identify and map earthquake faults.
Watch the video below from the United States Forest Service titled "Modeling Biomass and Canopy Fuel Attributes Using LiDAR"
Watch the "Introduction to LiDAR" video below from ASPRS (American Society of Photogrammetry and Remote Sensing)
Course information (including lecture materials) for Penn State's "LiDAR Technology and Applications" Course (Geography 497D). See the course outline (bottom left) for access to lecture materials and readings.
NOAA Coastal Service's Center Digital Coast web site for downloading LiDAR data and other coastal datasets. The web site includes access to the 2009-2011 LiDAR collection (2 pts./square meter) that includes coastal areas of Sonoma County.
The Vegetation Mapping Program kick off meeting was held on December 13th at the Agricultural Preservation and Open Space District office in Santa Rosa. Thanks for the great turnout! The meeting provided an opportunity to get the word out on the mapping program and to hear ideas and input from map stakeholders and potential end users. Tom Robinson, the mapping program manager, outlined the goals of the program, introduced the mapping team, discussed program development/fundraising, and reviewed ways to get involved. Mark Tukman, the mapping team project manager, presented the Vegetation Mapping and Remote Sensing Advisory Committee and reviewed the technical mapping approach. A question and answer session followed the presentation.
The kickoff was attended by numerous stakeholders and vegetation and habitat map end users. Attendees represented numerous groups and organizations, including the following:
AECOM
Audubon Canyon Ranch
Baseline Consulting
Botanical and Ecological Consulting
California Coastal Conservancy
California Dept. of Fish and Wildlife
California Dept. of Forestry and Fire Protection
City of Santa Rosa
County of Sonoma Permit and Resource Management Department
Open Space District Citizen's Advisory Committee
LandPaths
Marin County Parks and Open Space Department
NOAA - National Marine Fisheries
Ocean Song Farm & Wilderness
Pepperwood Preserve
Planet Horticulture
Private Landowners
Prunuske Chatham Inc.
San Francisco Bay Joint Venture
San Francisco Estuary Institute
Sonoma County Regional Parks
Sonoma County Water Agency
Sonoma County Winegrape Commission
Sonoma Ecology Center
Sonoma Land Trust
Sonoma State University
United Winegrowers for Sonoma County
Wine Country Group Real Estate
Environmental Planning and Engineering Firms
The slides from our kick off presentation are available here. Audio of the meeting and video of the accompanying slides is provided below via YouTube. Notes from the question and answer session can be viewed here.
Sonoma County has numerous dates of countywide imagery available for public use. The vegetation mapping program will benefit greatly from the imagery throughout our mapping process. All image services are hosted by by the Sonoma County Information Services Department; some are also hosted by the University of California. Thanks to Tim Pudoff and his team at Sonoma County ISD and Dr. Maggi Kelly, Nancy Thomas and the Geospatial Innovation Facility (GIF) at the University of California, Berkeley! Image services can be accessed using ESRI products, such as ArcMap and ArcGIS Online.
To add these services in ArcMap, go to "Add Data from ArcGIS Online" and search for "Sonoma County Imagery". Or send a membership request to join the Sonoma County Imagery Group to make accessing these services easy from within ESRI products. The gallery below shows the current set of image services available in the Sonoma County Imagery Group.